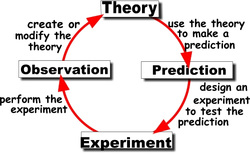
Experimental Design
|
E ) Experimental Data |
F ) Variables |
|
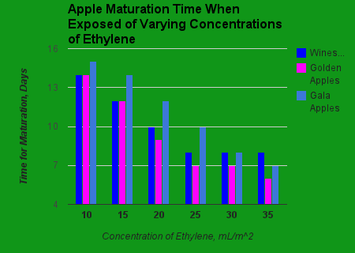
I was given data to make a graph, below. I used a Google spreadsheet to create a graph and I saved my image file to upload here. My graph demonstrates an inverse relationship between sun and shade because it was observed that as sun increases, the days it takes to grow the tree decreases.
|
Part 2:Types of apples
G ) HypothesisI selected amount of sunlight from a list of environmental variables I developed with a partner.
I believe that sunlight may affect the growth of a variety of apple trees because I have observed apples grow faster when in normal weather with sunlight and noticed the others take longer to mature. If my hypothesis is true, I will see the apples in the sunlight grow faster than the others in the shade and cold weather. |
H ) Control GroupsIt is important to control variables in an experiment because you have to watch over what the experiment does.
Control Group: Apples in the sun 24 hours a day Experimental Group/s: Apples in the dark 24 hours a day |
I ) Experimental DesignExperimental Procedure
|
J ) Expected Results
Part 6: I would expect the apple trees in the sunlight 24 hours a day to grow faster and the apples in the dark 24 hours a day to grow slower.
